top of page

Check back soon
Once posts are published, you’ll see them here.
Live Streams - Upcoming
Live Streams - PREVIOUSLY RECORDED
S&OP MEASUREMENTS – What Does “Good” Look Like? Pt 8
MEASUREMENTS. A sequential approach to measuring S&OP success works best, starting with measuring the S&OP process. Once the process is work
S&OP SUPPORTING DATA – What Does “Good” Look Like? Part 7
Supporting S&OP data should tell the story and balance the plan. It should support accountability and provide risk assessment, and more.

S&OP – WHO’S RESPONSIBLE, ACCOUNTABLE? – What Does “Good” Look Like?" Part 6
Part 6 of our “What Does Good Look Like?” takes us into a discussion of who is responsible and accountable within an executive-led S&OP.
EXECUTIVE S&OP ONLINE ASSESSMENT (free) - What Does “Good” Look Like?
You can now use a quality online assessment tool for your entire process, from the first demand meeting to the final Executive S&OP meeting.

S&OP Planning Horizons - "What Does Good Look Like - Part 5"
In Part 5 of "What Does Good Look Like?", we look at the right planning horizons, the components, and how to calculate what is needed.
S&OP EXECUTIVE PRESENTATION - What Does “Good” Look Like? Part 4
Executive S&OP is a regular and repeatable process that allows the executive to participate in the execution of strategy.

Family Design - S&OP: What Does “Good” Look Like? Part 2
The secret sauce of all successful S&OP starts with family design.
In part 1 we began an extended discussion on how to know whether each S&O

Overview: What Does “Good” Look Like? Part 1
We’ve spent a lot of Live Stream time explaining the unique concepts behind the DBM approach to S&OP. We’ll pivot to discussing how to know
PINPOINT FOCUS: Net Landed Profit Analytics PART 3
This week, we focus on Part 3 of NET LANDED PROFIT (NLP) Analytics: Using our net landed profit model to yield pinpoint insights for action.

S&OP Risks and Assumptions – Documentation, Process, Accountability
S&OP Risks and Assumptions should be part of every S&OP family presentation at the Executive S&OP meeting. Because S&OP is a forward-looking

Are You Ready for Culture Change? THE CAPABILITY TRAP
70% of change efforts fail. The Capability Trap is a barrier. We’ll get into five steps to avoid this and make sure your progress continues.

Net Landed Profit Analytics Step 2 - DO Use Cost to Serve - DON’T Use Cost Accounting
Net Landed Profit stmnt is created, driven down to every SKU, customer, location, etc. to find profit leaks, prepared to visualizatize.

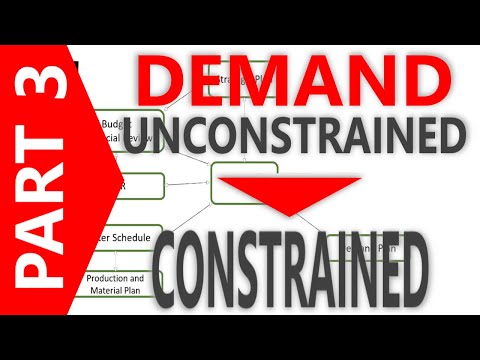
Demand Part 5: Decisions, decisions… Who Gets What? (constraining)
This week, we’ll get into the flow of decisions on WHICH demand to allocate from constrained supply.

LEAN: Respect for People, Pt 2 of 10 - Unconscious Bias
Respect for people is a Cornerstone of LEAN, but so often missing. The bottom line is that many of the root causes of waste, overburden,...

S&OP and Demand - Tolerances and Accountability
Demand - Tolerances and Accountability

Beza Livestream, Net Landed Profit – How To / Introduction
Richard Sharpe of Competitive Insights speaks with us regarding his approach, honed over 30 years, at implementing a NET LANDED PROFIT v
Demand Planning Pt 3: Skip This Step At Your Peril
In Part 2, we discussed demand streams modeled in units, not dollars, as the way to go. What about constraints on those demand streams units


Demand Planning Part II: DEMAND STREAMS – what are they and how do you use them?
Demand Planning Part II: DEMAND STREAMS – what are they and how do you use them?
Demand Streams are the right way to model demand flowing i


S&OP & Demand Planning Part 1
Demand Streams are the right way to model demand flowing into an S&OP family. Importantly, demand planning is a distinct process from...

What's Wrong with Your Culture? Possibly Not Having a Road Map.
Various measures of work satisfaction are continuing to descend while many orgs are simultaneously trying to build culture. What is missing?


Score Carding Your Executive S&OP Process
Beza Livestream, S&OP Thursday: Yes, you can and should scorecard your Executive S&OP Process itself AND improve it month-to-month.
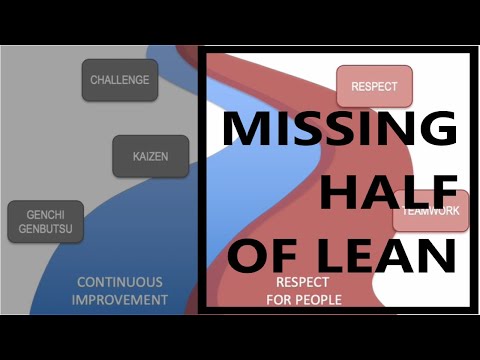
The missing half of LEAN = respect for people
RESPECT FOR PEOPLE: Your lack of disrespect is not respect, at least not in the way lean is practiced in world-class orgs. We'll...

S&OP and Con-STRAINED Supply Chains
S&OP Thursday Live Stream (LinkedIn & YouTube): Your S&OP families should be based on supply constraints, not broken by them!


Cutting through it all: An executive-led S&OP with executed results
S&OP is the President's handle on the business...Marshall & Doug explore the Five Section Sheet (5SS) and essentials to an executable S&OP.
bottom of page